Digging into the Q2 MoneyTree™ Report
I spent some time recently digging into the Q2 Life Sciences MoneyTree report by PWC. I wondered how the Medical Device industry is faring these days for new venture capital investment. There are some interesting medical device funding trends for sure.
Significant deals this quarter included Holaira ($42M Series D – catheter system for COPD therapy), Inspire ($40M Series E – implantable sleep apnea device), Benvenue ($40M series E + $24M debt – vertebral fracture devices).
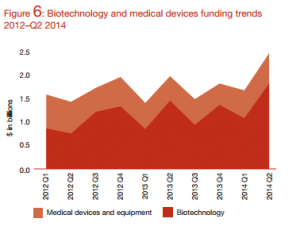
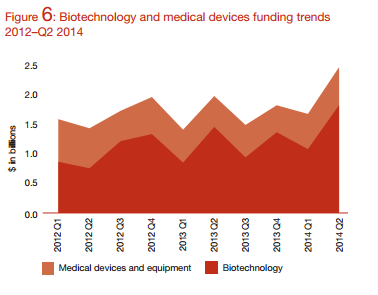
Take the MoneyTree chart showing how much more money biotech is getting than medical devices. This got markedly more extreme in the past quarter with almost three dollars in biotech invested for each dollar in medical devices.*
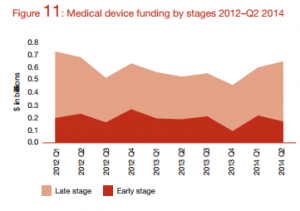
The split between early and late stage investment is noticeably later this quarter compared to Q1 but not nearly so extreme as in Q4. Surprisingly, the overall picture has been quite steady over the past two years. You could almost draw a line at $180M per quarter in early stage investments other than Q4/13 in particular.
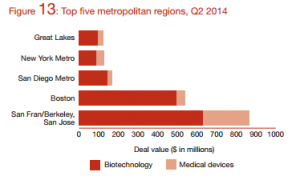
Where money is going geographically is always interesting. Northern California and Boston now dwarf the rest of the US in attracting venture capital.
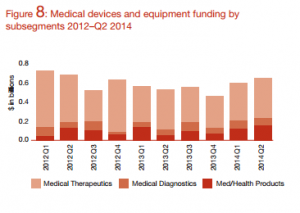
The most intriguing chart for me was the split between various medical device sub-segments.
Total device investment has been rising for the past two quarters. However, over the past two years it’s been quite steady at around $600M per quarter.
Other than looking at totals however I found this stacked bar format a little tough to read so extrapolated the graph into this more detailed line chart view. **
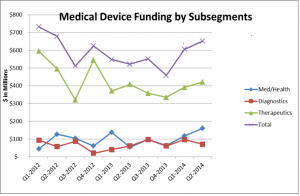
Investment in devices has been rising about 40% over the past two quarters, however, it has not hit the levels seen in early 2012. And the growth has not been uniform across all three segments.
Diagnostic device investment trails the pack again and dropped from Q1– about the same level as Med/Health. There was a dramatic dive in investment in diagnostics in late 2012 and early 2013 that has corrected and seems to be running steadily at around $80M per quarter average over the past year. In the four quarters previous to this one these two sub -segments are almost indistinguishable. This quarter the two have split significantly. Next quarter we’ll see whether Med/Health pulls farther ahead.
The investment in med/health devices has been quite consistent for the past two years. This is worth noting because the hype around devices like Fitbit and other wearables has been more recent. There is one quarter of data showing that it’s rising to levels not seen for at least two years.
Investment in both therapeutics and med/health devices have grown over the past two quarters. Note the ratio between diagnostics and therapeutics. Last quarter over $6 was invested in therapeutic devices for every dollar in diagnostics. This ratio is higher than it’s been for a year. At StarFish we have seen a long term trend of about 2:1 for therapeutics over diagnostics which is a lot different than the VC numbers.
So what do we in the medical device business take from all this information? Overall investment in the sector seems to be getting stronger. It’s a relatively good time to look for money, particularly growth capital. The trend for early stage money is flat to slightly down. Within medical devices if you’re running a startup looking for venture capital it’s much better to be in therapeutics than diagnostics. It may be a good time to raise money for Med/health companies too.
Next quarter I’ll build on these insights and see what trends can be dug out again. Thanks to PwC for assembling these fascinating snapshots on medical device funding and our industry.
*All charts from report “Biotech soars to record high” MoneyTree Q2 2014 report ©2014 PwC – Published August 2014.
**Extrapolation based on Medical Therapeutics data point of $421M from Q2/14 provided in report.
Scott Phillips is Founder & CEO at StarFish Medical. Scott holds a degree in Engineering Physics from the University of British Columbia. Under his leadership StarFish has grown into a diverse professional organization with clients around the world and 100% focus on medical devices.
Images: Q2 2014 MoneyTree™ Report
