Spectrometer from home materials
Make a real-time, wavelength-calibrated spectrometer using common household items.
Like many others, I’m currently working from home due to the ongoing COVID-19 crisis. Fortunately, a significant portion of my optical engineering work, such as research, modelling and design, can be done without going into the office. On the other hand, I generally avoid going into my lab unless it’s absolutely necessary, which has largely prevented me from doing hands-on optics work for the moment.
The current state of affairs has made me curious about what kinds of optical devices can be made using only common components that I have at home. A well-known optical demonstration1 involves using a cereal box, a compact disk, and some aluminum foil to make a simple spectrometer (a device that measures the constituent colours of a light source and their relative intensities – the source’s “spectrum”). In this demo, one usually views the spectrum directly just by looking at it. This approach effectively shows the principles of a spectrometer and gives an impression of what the spectra of various light sources look like, but it does not give quantitative information, nor does it allow for spectra to be recorded for further analysis. I will show that by using a webcam, some code and a bit of know-how we can turn this apparatus from a demonstration into a spectrometer from home materials.
While most of the components used in this device would not be appropriate for real design work, there are some parallels to that activity. In both cases, work is done under material constraints to achieve a given goal. Examples of common constraints include cost, manufacturability and availability of components. In this case I am limited to working with what I have on hand. This activity also has some similarity to the early stages of design (proof-of-concept and prototyping). It is useful to make a simple version of a device using readily available components before moving to specialized components and custom assemblies.
The Cereal Box Spectrometer from home materials
Generally, a spectrometer consists of only a few elements: a small hole or slit for light to enter; a dispersive element (a grating or a prism) which spreads the light from the hole/slit into its constituent colours; focusing elements (a lens/lenses or curved mirrors) that make multiple adjacent images of the hole/slit, separated by colour; and an image sensor (similar to those found in digital cameras) onto which the images are projected. A spectrum results from mapping positions on the sensor to specific wavelengths and measuring the intensity at each position.
As shown in the referenced demonstration1, the basic setup of the cereal box spectrometer involves making a slit on one side of the box from aluminum foil, and then positioning a compact disk such that the light from the slit is dispersed (by colour) and exits a hole in the top of the box through which it is viewed. Prior to the addition of the webcam, my setup is largely the same with a few small differences: I have chosen to use a DVD in lieu of a CD because it has finer data-carrying grooves2. This gives a more “spread out” spectrum3, effectively improving the wavelength (colour) resolution of the spectrometer as adjacent images of the slit can be distinguished with less difference in colour. Additionally, my viewing hole is made just big enough for the webcam to view inside, so that the housing of the webcam fully covers the hole. This is important to limit the amount of ambient light that can enter the box, so as little as possible of the light reaching the webcam comes from sources other than the slit.
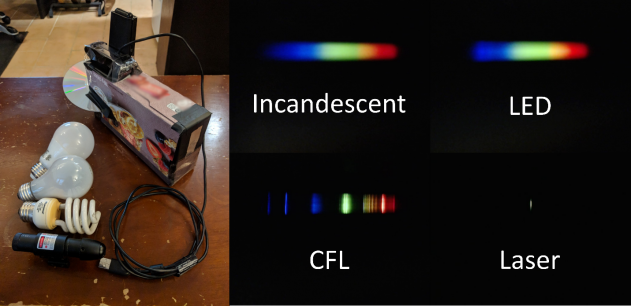
After mounting the webcam, I can immediately set the camera focus and exposure and start recording images of spectra using standard webcam software. A picture of the assembled spectrometer, and the imaged spectra of a few light sources can be seen in Figure 1. The spectra observed are typical of the light sources used. The incandescent light has a broad spectrum due to blackbody radiation. The LED light (this particular one is a “soft white” LED bulb) has a broad spectrum from an emitting phosphor along with an additional shoulder on the blue side of the spectrum, corresponding to the light used to excite the phosphor. The compact fluorescent (CFL) bulb’s spectrum shows discrete lines corresponding to photoluminescence from specific energy changes in the excited gases within and in the phosphors in the coating. Finally, the laser’s spectrum is a single peak, demonstrating the monochromatic nature of continuous-wave lasers4.

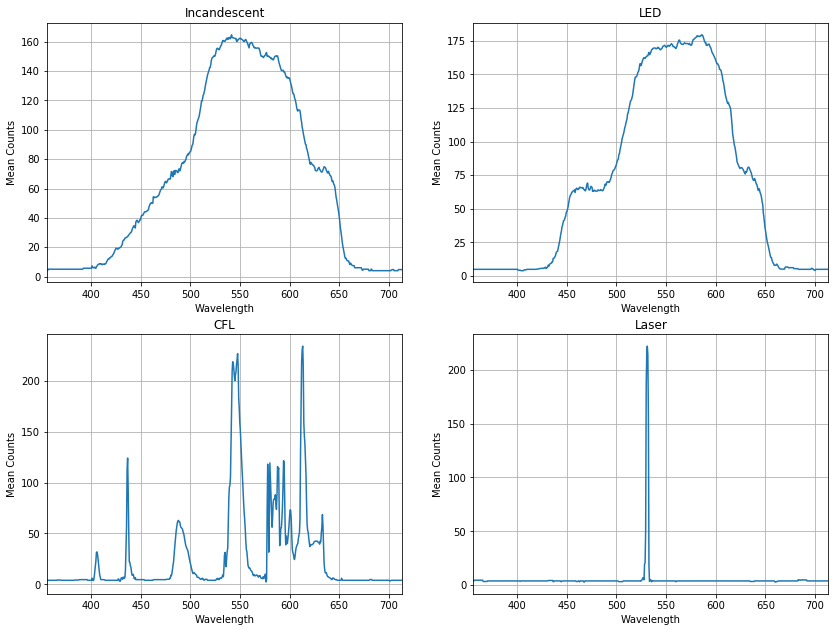
The images in Figure 1 show the general characteristics of each light source’s spectrum. However, they do not provide quantitative information about the specific wavelengths in each source. To map the imaged spectra to wavelengths it is necessary to have a light source with discrete peaks at known wavelengths for calibration. Fortunately, the CFL bulb used is such a light source5. To perform the calibration, I first converted the CFL image to greyscale by averaging each of the RGB channels. I then took a 4-pixel high horizontal cross section of the data and averaged it over the vertical axis. By plotting this cross section against the numbered pixels of the detector, I identified the positions of the main peaks (in terms of pixel numbers) and found the corresponding wavelengths from the known CFL spectrum. Finally, doing a linear fit of the known wavelengths as a function of the corresponding peaks’ pixel numbers yielded an equation that relates each pixel in the region of interest to a specific wavelength. The resulting wavelength axis was then applied to each of the recorded spectra. Examples of resulting wavelength-calibrated spectra are shown in Figure 2.

Given the ability to plot the spectra against wavelength, I wanted the images collected by the webcam to be converted to wavelength-mapped spectra automatically and in real-time. To achieve this end, I wrote a simple app in Python using the cv2 package to interface with the webcam. This app takes images from the camera (with a controllable exposure time to prevent saturation) and converts them to greyscale. It then isolates the cross section of the spectrum (which always appears on the same pixels) and averages over 4 vertical pixels. Finally, it displays the relevant pixels of the webcam for monitoring and the resulting spectra to the user, updating in real-time. An example of the completed device in use is shown in the video below. https://www.youtube.com/embed/5s7-ebmzjQY
The spectrometer in action!
Some limitations of this spectrometer should be noted. The true intensity of the light across the wavelength axis is not perfectly proportional to the counts measured on the camera for a number of reasons: the sensitivity of the detector to different colours is unknown and has not been corrected for; the conversion to greyscale preserves the subjective ‘brightness’ of the images, but does not preserve the true intensities; and the webcam has an infrared (IR) filter that prevents IR light from being measured (in particular, we would expect the incandescent bulb to show a lot of light in the IR). All of these lead to distortions in the relative magnitude of the spectra at different wavelengths. Furthermore, the spectrometer’s relatively large slit and acceptance angle can sometimes lead to distortions in the spectrum arising from the spatial extent of the light source and its orientation relative to the slit.
Conclusion
In this blog, I have shown how to build a real-time, wavelength-calibrated spectrometer from home materials. Aside from a computer to run the code, the only significant expense is the webcam, which was purchased for ~$100 CAD. While the resulting device is admittedly not on par with commercial spectrometers for the reasons discussed above, I think it’s fair to say it’s not bad for a cereal box.
1 An example of this demonstration with detailed construction instructions can be found at http://coolcosmos.ipac.caltech.edu/cosmic_games/spectra/makeGrating.htm
2 T. Pencheva et al., 33rd International Spring Seminar on Electronics Technology, ISSE 2010, Warsaw, pp. 531-535, 2010 (conference paper)
3 The angle that light diffracts from a grating is given as a function of wavelength by:

in which![]() is the angle of incidence,
is the angle of incidence,![]() is the width of the grooves,
is the width of the grooves,![]() is the wavelength, and
is the wavelength, and ![]() is the diffraction order (
is the diffraction order (![]() = 1 in this case). This equation implies that the angle of diffraction changes more as a function of wavelength when the width of the grooves is less.
= 1 in this case). This equation implies that the angle of diffraction changes more as a function of wavelength when the width of the grooves is less.
4 It should be noted that it is difficult to reliably take the spectrum of a laser using this device because of the laser beam’s brightness, directionality, and small size (which does not completely cover the lateral dimension of the slit), and the spectrometer’s large acceptance angle. A simple way to make this measurement easier is to cover the slit with a diffuser, which scatters the light from the laser in all directions. A small piece of toilet paper can be used for this purpose, and I’m sure we all have plenty of that.
5 An example of a typical CFL spectrum with wavelength-labeled peaks can be found at https://commons.wikimedia.org/wiki/File:Fluorescent_lighting_spectrum_peaks_labelled.png
Ryan Field is an Optical Engineer at StarFish Medical. Ryan holds a PhD in Physics from the University of Toronto. As a post doctoral fellow, he worked on the development of high-power picosecond infrared laser systems for surgical applications as well as a spectrometer from home materials.
Images: StarFish Medical