
Enhance Early Risk Analysis with Online Whiteboards
TL;DR
- Early risk analysis under ISO 14971 is most effective when the method matches the stage: mind maps for exploration, spreadsheets for documentation.
- Graphical mind maps let teams represent hazardous situations, event sequences, and mitigations visually, which is difficult to replicate in spreadsheet formats.
- Online whiteboards like Miro lower participation barriers for interdisciplinary teams and support both independent and group work in real time.
- The example workflow covers a top-down approach starting from hazard types, and notes that a complementary bottom-up pass is also needed for thoroughness.
- Mind map content feeds directly into formal analysis methods including Fault Tree Analysis and FMEA, making the early investment useful beyond the brainstorming stage.
Graphical mind maps created in online whiteboards offer a low-barrier, highly collaborative approach to early risk analysis in medical device development.
Governed by ISO 14971, risk analysis is a core component of medical device risk management and regulatory submissions. It also directly influences device architecture, performance, and user experience. Identifying risks and associated mitigations early in the development process helps minimize technical uncertainty and reduces the likelihood of costly changes later on.
Use the Right Tool for the Right Task
Graphical mind maps in online whiteboards are well suited to early risk analysis, which should begin with an interdisciplinary review of the device architecture. In this review, participants should be able to freely brainstorm, jump from one idea to another, and explore connections to identify hazardous situations and develop sequences of events that might lead to harm.
While spreadsheets are well suited to documenting mature risk analysis in formal templates, online whiteboard mind maps are better matched to the dynamic, exploratory nature of early brainstorming. Choosing the right tool and method is essential for maximizing the value of early analysis efforts.
Graphical Approach
Mind maps are diagrams that represent information in a structured, interconnected way. They typically start with a central idea or theme, with branches radiating outward to represent related topics and hierarchies of information. Mind maps are commonly used for brainstorming and organizing thoughts. They help in visualizing complex relationships between ideas, making it easier to understand and recall information.
Given these advantages, mind maps are an ideal method for conducting early risk analysis. Each mind map instance can be used to capture a specific hazardous situation and harm at its core. The branches stemming from there can capture the many sequences of events that could lead to the hazardous situation. The graphical format lets teams absorb content quickly, making communication and engagement more effective across internal and external audiences.
Enhanced Collaboration
Where mind maps provide a great method for early risk analysis, online whiteboards deliver the tools to create the maps and the environment to enhance collaborative brainstorming. Online whiteboards, like Miro, are virtual platforms that function much like traditional physical whiteboards. They allow teams to create, share, and collaborate on visual content in real time, with equal access for all participants regardless of location.
With a low barrier to entry and an intuitive interface, online whiteboards facilitate early risk analysis brainstorming by encouraging active participation from all members of the interdisciplinary development team. The tool supports focused group work on specific hazardous situations and lets participants generate content independently. All of this is built within an environment that is ideal for quick sorting and organizing of risks into hazard themes and consolidating related event branches. Online whiteboards alleviate the usability, accessibility, and flexibility barriers of spreadsheets. They also increase engagement and help teams extract more value from every participant. This results in more focused and productive early-stage risk analysis brainstorming sessions.
Example Workflow
The following example describes one way of executing early risk analysis brainstorming. The steps are identified in the attached figure.
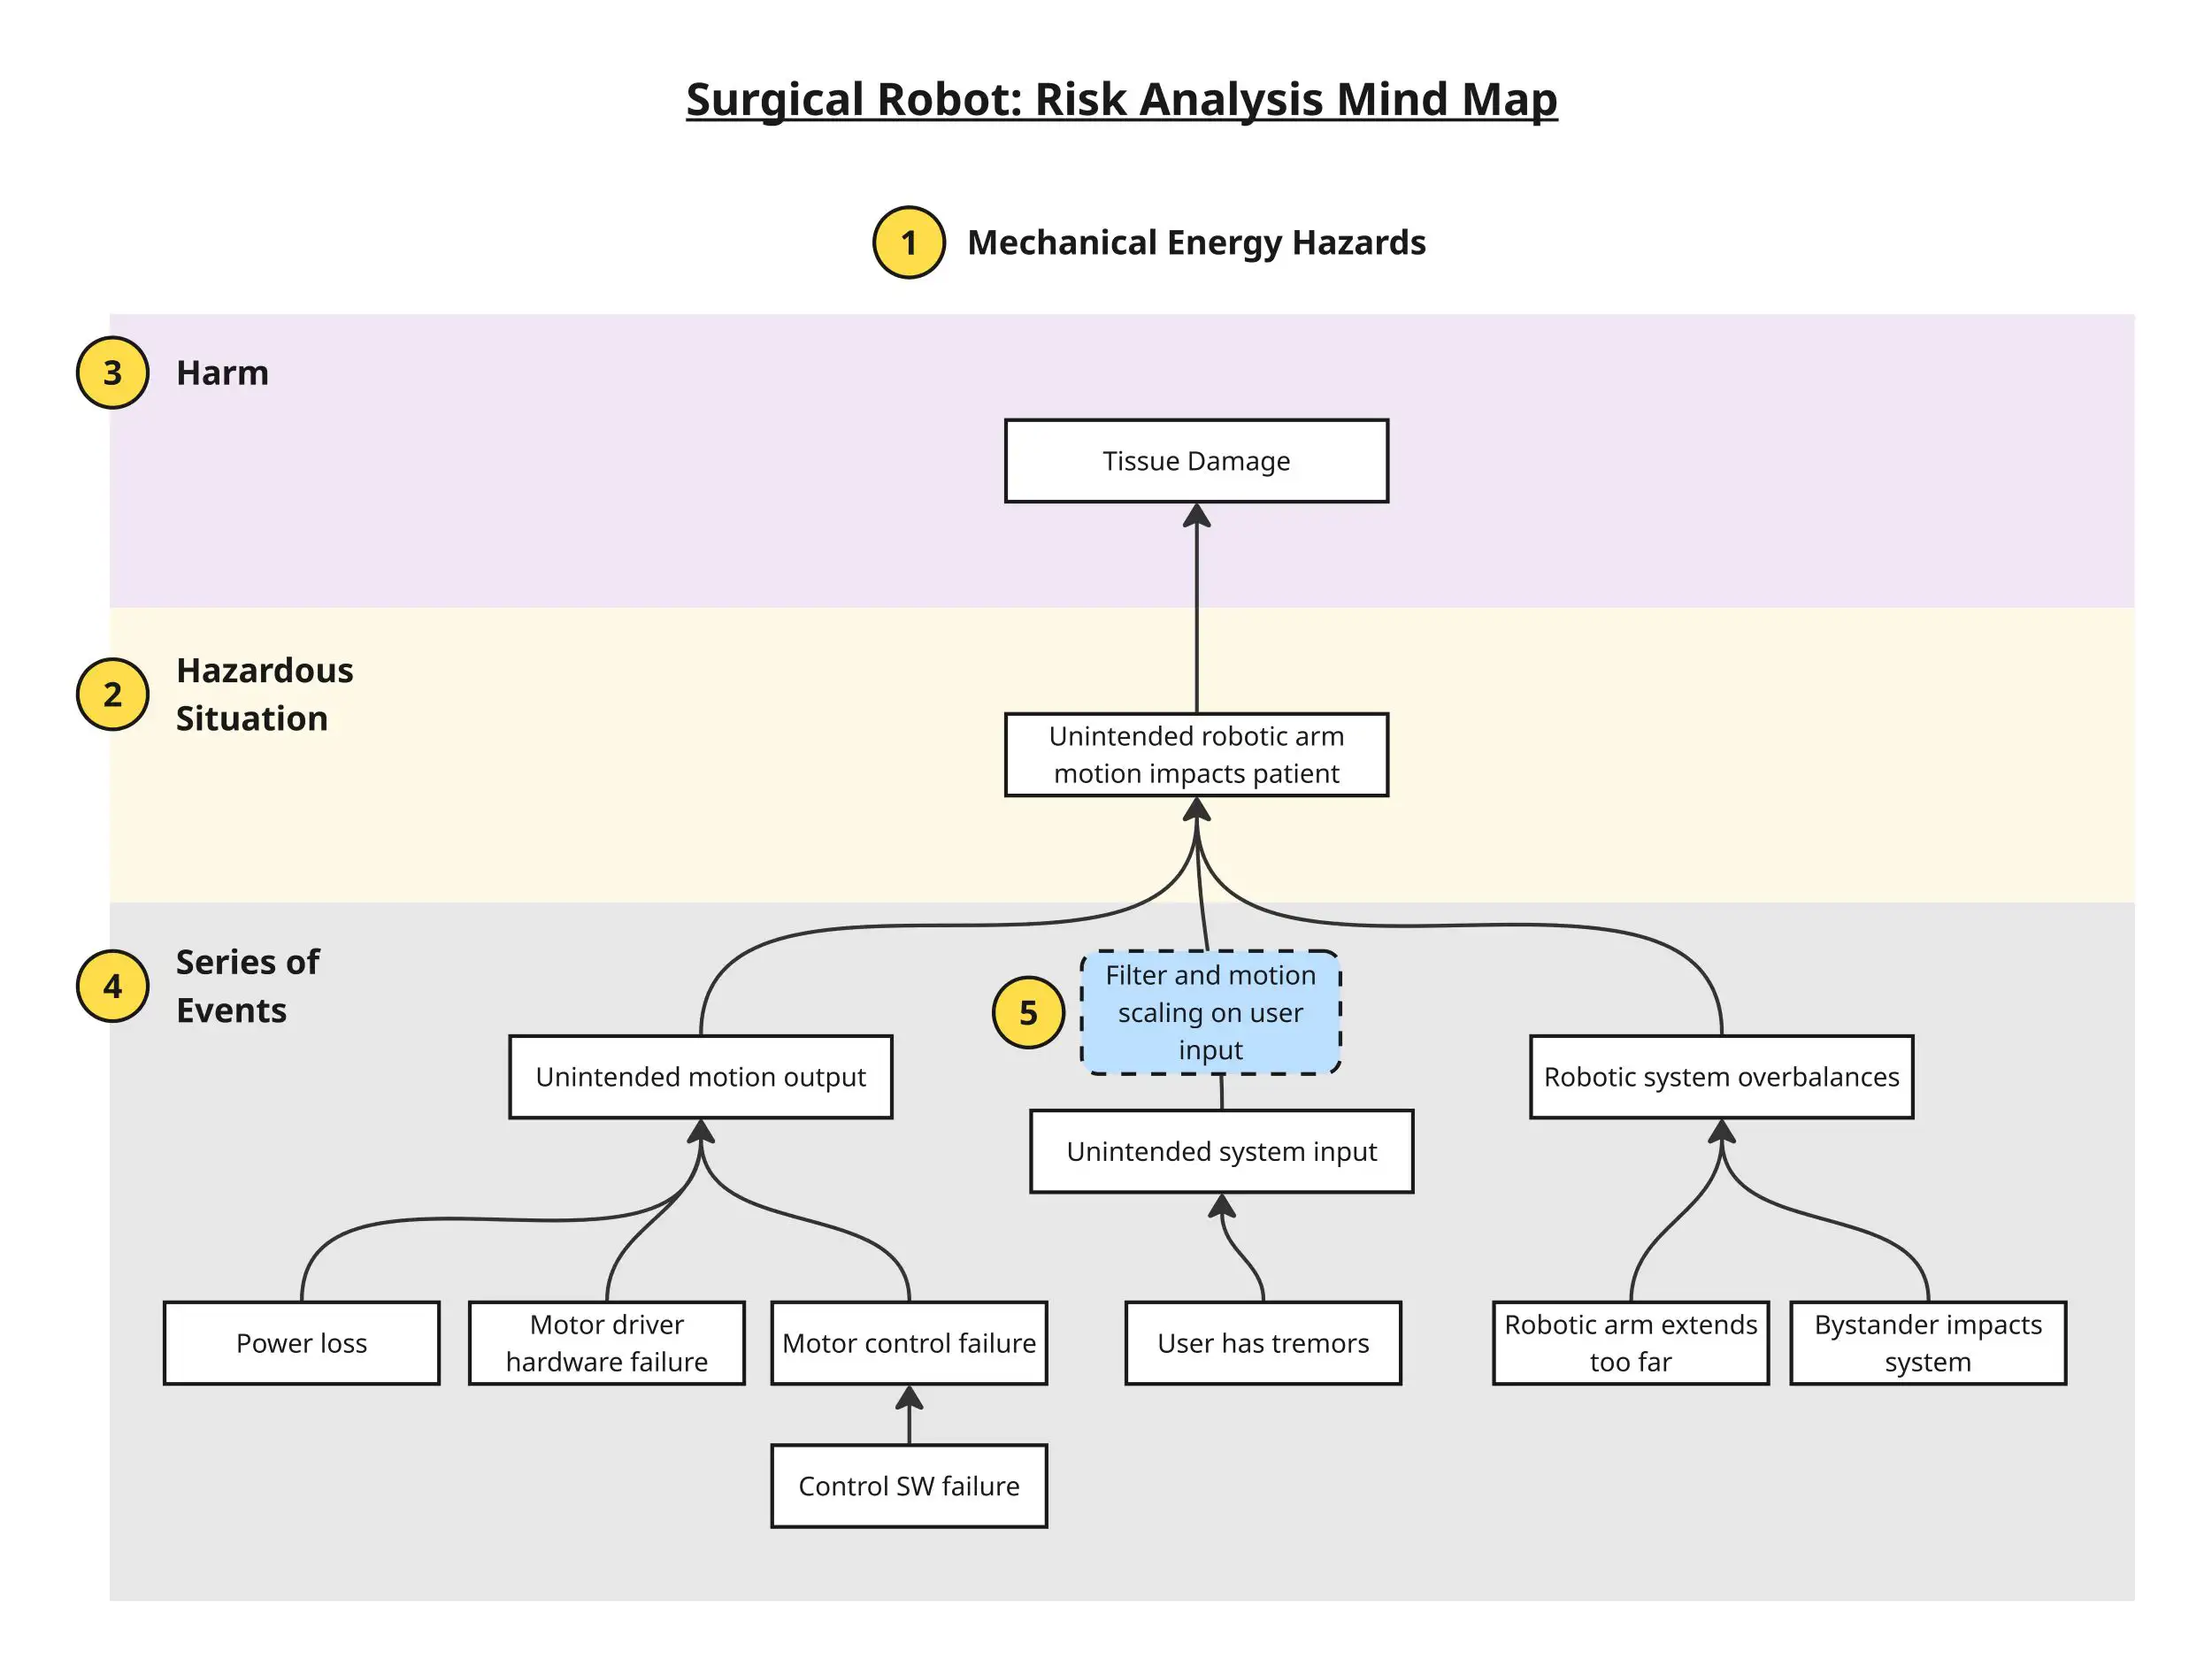
Begin by identifying the type of hazards, or potential sources of harm, that are applicable to the device architecture (1). ISO 14971 provides a list of hazard classes that can be used as a starting point. These include energy hazards, biological or chemical hazards, information hazards, and functional hazards. Delineate separate areas in the whiteboard for each applicable hazard type.
Next, leverage the interdisciplinary expertise of the participants. Ask participants to create a text box in the appropriate hazard area for each hazardous situation (2): a circumstance in which people, property, or the environment are exposed to a hazard.
If desirable, create a new text box branching downstream from each hazardous situation to add information about the general harm (3) that could result from the hazardous situation. Further analysis with medical professional input will be required to detail the harms and their severities, but an initial placeholder for harm in the mind map can provide context for discussion.
As a team, brainstorm and create interconnected text boxes upstream of each hazardous situation to capture all the possible foreseeable sequences of events (4) that could lead to the hazardous situation. Each text box should contain a single event, connected to its chronologically preceding and subsequent events. This will in many cases resemble a tree of multiple parallel branches, sometimes with interconnecting branches where there are common series of events between hazardous situations. These relationships are difficult to represent cleanly in spreadsheets.
An interdisciplinary discussion about the sequences of events is important at this point since the events leading to a hazardous situation are not necessarily related or limited to the hazard type. For example, a harm caused by mechanical energy is not necessarily due to an event of mechanical failure; it could be due to an event of use error or electrical fault.
This example workflow described a top-down approach for generating mind maps starting from hazards and hazardous situations. However, the method and tools are equally well suited for a bottom-up approach, starting from specific failure or initiating events. Indeed, both top-down and bottom-up approaches should be taken to ensure thoroughness of the risk analysis.
Once the mind maps are suitably fleshed out, the intent is for the team to brainstorm and ideate on risk mitigations. These can be conveniently represented in the mind maps by placing a text box containing the mitigation description (5) at the location along branches where it would prevent or reduce the likelihood of the sequence of events leading to the harm.
Early Efforts Bear Fruit
At this stage the value of the mind maps becomes apparent. The visual representation of mitigations overlayed onto the event branches facilitates mitigation strategy discussions. Is the mitigation sufficient to provide coverage across all the intended sub-branches? Does an additional mitigation need to be developed to address any gaps? Could a different mitigation be placed further downstream, closer to the harm occurrence, to provide more effective coverage? Does the device architecture need to be revisited to reduce the overall risk profile? The mind map method and collaborative whiteboard tools facilitate initial risk analysis such that a risk mitigation strategy can be developed earlier to inform the device design.
Only the Beginning
As risk management activities mature, more formal methods are needed for scoring probability and severity, computing risk scores, and preparing regulatory submissions. Mind maps provide a valuable foundation for this work. The insights captured can be directly leveraged to accelerate more structured analyses, such as Fault Tree Analysis (FTA) and Failure Mode and Effects Analysis (FMEA), and to inform how risks are ultimately organized within formal documentation. Overall, by investing in this early mind map work, development teams set themselves up for more coherent risk management while informing critical design decisions and mitigating the likelihood of costly downstream changes.
Matthieu Lemay is Systems Engineering Team Manager in Product Development at StarFish Medical. Matt holds an architecture degree from the University of Waterloo and a BASc in Biomedical Mechanical Engineering from the University of Ottawa. He draws on his design background when working on early-stage medical devices.
Images: Adobe Stock
Related Resources
Nick and Nigel breaks down what actually goes into the cost of getting a sterilized device into a user’s hands, and why up to 30% of costs can sit in places most teams don’t plan for.
Theranostics combines diagnosis and therapy into a single targeting system, using one ligand to attach to two different radioactive payloads, one for imaging and one for treatment. It represents a significant shift in how cancer is being identified and treated. But the theranostics delivery workflow tells a different story.

Most medical devices were designed for clinical settings, not the patients and caregivers who increasingly rely on them at home. Here’s what good home-use device design actually requires.

How do you measure comfort in medical device design? Explore the tools, scales, and study design principles that turn a subjective experience into actionable design data.