How Pulse Oximeters Work
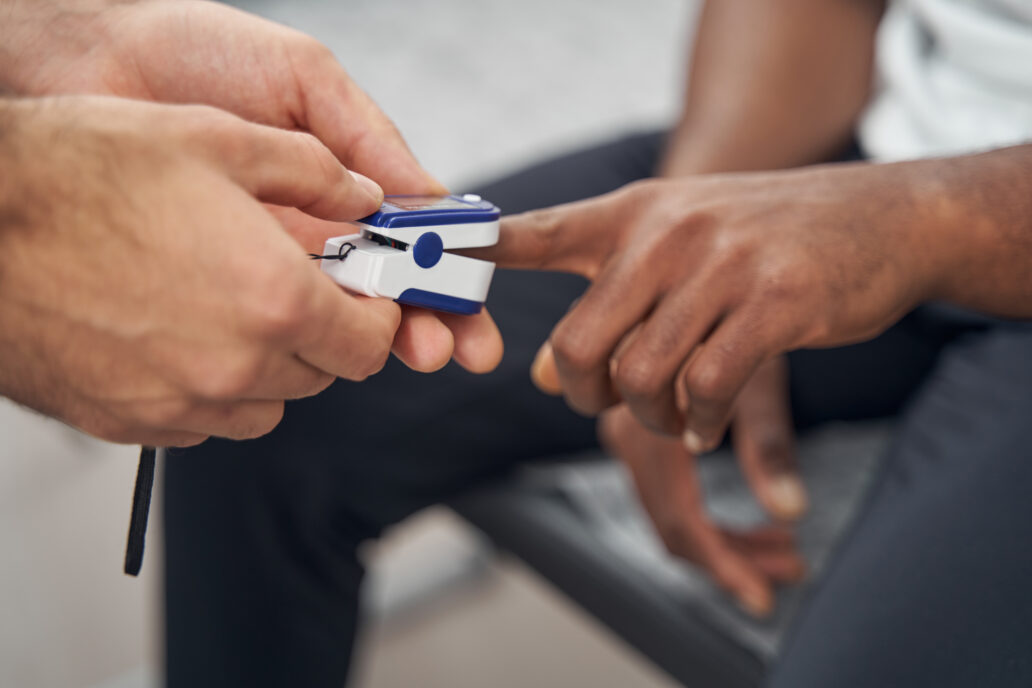
If you’ve ever been to the hospital, you’ll know that one of the first things hospital staff do is attach “that finger clip device” to your finger. “That device” is called a Pulse Oximeter, and it provides information on pulse rate and blood oxygenation. Although these devices are generally not considered “diagnostic”, per se, clinicians can use the reported values and trends to inform clinical decisions. This blog is aimed at medical device developers who want to understand the core technical ideas underlying pulse oximetry, as well as the challenges Pulse Flow Oximeter device manufacturers must face and surmount.
How pulse oximeters work
The job of your arteries is to distribute oxygen throughout the body in support of metabolism. The workhorse of oxygen transport is the hemoglobin molecule in your red blood cells. This molecule occurs in two main forms: oxygenated (in which an oxygen molecule is bound at the center of the molecule for transport) and deoxygenated (in which the oxygen is absent). In a healthy person, the hemoglobin in arterial blood is predominately oxygenated; conversely, in a person in distress (respiratory, cardiac, etc.) the oxygenation can be reduced – eventually leading to hypoxia. The proportion of oxygenated hemoglobin is called the saturation:
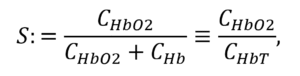
in which CHBT is the total concentration of hemoglobin in the blood, CHB02 is the concentration of oxygenated hemoglobin, and CHB the concentration of deoxygenated hemoglobin. In healthy individuals, S lies between 95% and 99%. If S drops below those levels, it’s an indication of metabolic distress.
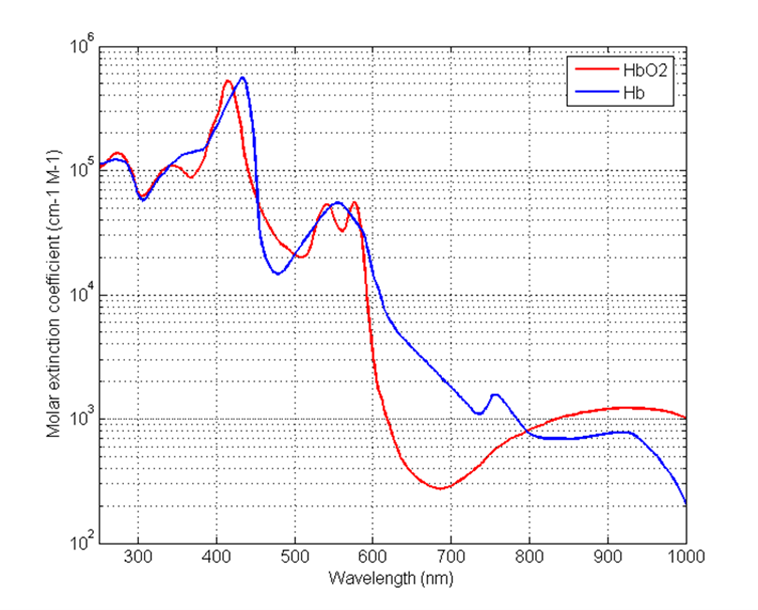
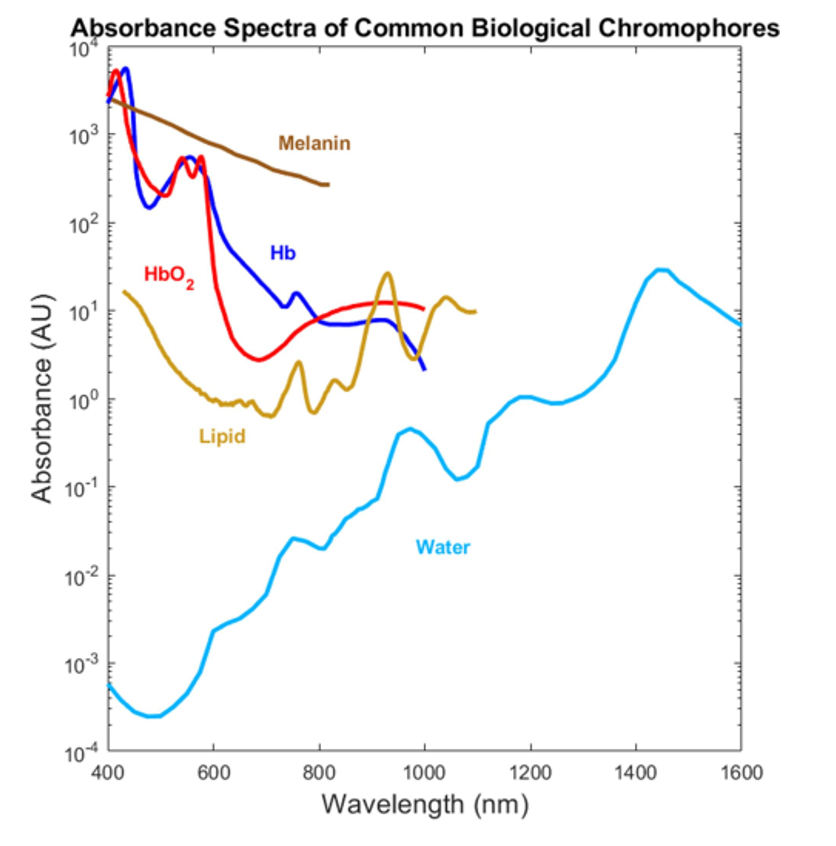
Due to their different molecular configurations, oxygenated and deoxygenated hemoglobin absorb light to different degrees, as indicated in Figure 1. This difference in absorption lies at the heart of pulse-flow oximetry.
Pulse oximeters consist of light sources (generally LEDs) on one side of your finger and light detectors (photodiodes) on the other side. By measuring the amount of light transmitted through the finger, these devices can infer the amount of blood oxygenation in your blood vessels through the aforementioned difference in absorption depending on oxygenation state. Generally, the light source and detector are on opposite sides of clip or sleeve that is placed on a patient’s finger, which is highly vascularized. (Note that other configurations are possible.)
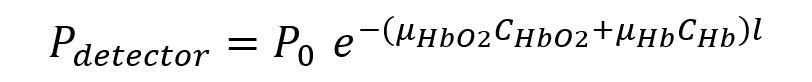
If the only finger material that absorbed the light was hemoglobin in the blood, the transmitted light would decrease exponentially with the distance of blood through which the light passed, and the detected power Pdetector would be mathematically described by:
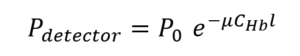
in which P0 is the optical power passing into the finger from the light source, l is the path length in the finger, CHB the concentration of hemoglobin along that path, and μ is the absorption coefficient of the hemoglobin in the blood.
However, as discussed above and shown in Figure 1, that aborption coefficient depends on whether the blood is oxygenated or deoxygenated. So we might better write:
We can re-express the above equation in terms of the saturation S as:
![A multi-step derivation showing how the detected light power in tissue is related to oxygen saturation (S), based on the Beer–Lambert law: P₍dₑₜₑcₜₒᵣ₎ = P₀ · exp{ –[ (μₕbO₂·CₕbO₂ / CₕbT) + (μₕb·Cₕb / CₕbT) ] · CₕbT · l } = P₀ · exp{ –[ (μₕbO₂·CₕbO₂ / CₕbT) + μₕb·(1 – CₕbO₂ / CₕbT) ] · CₕbT · l } = P₀ · exp{ –[ μₕbO₂·S + μₕb·(1 – S) ] · CₕbT · l } where: P₀ is the incident light power, μₕbO₂, μₕb are the extinction coefficients of oxyhemoglobin and deoxyhemoglobin respectively, CₕbO₂, Cₕb, CₕbT are the concentrations of oxyhemoglobin, deoxyhemoglobin, and total hemoglobin, S is oxygen saturation, l is the optical path length. The final expression relates detected power to saturation and hemoglobin properties.](https://starfishmedical.com/wp-content/uploads/p-detector-3-1024x324.png)
This equation shows the relationship between detected power and the saturation parameter of clinical interest. If we knew the total concentration CHBT of hemoglobin in the blood, the exact path length l through the finger, the exact power P0 passing into the blood, and the absorption coefficients of oxygenated and deoxygenated hemoglobin (given in Figure 1), then we could work out the saturation parameter S. Of course, in practice, we know none of these with any certainty!
Pulse oximeters overcome this challenge by measuring the light transmission at two or more wavelengths λ1 and λ2. The idea is that, if we take the ratio of the power received, we obtain:
![A mathematical expression comparing detected light power at two different wavelengths (λ₁ and λ₂) to solve for oxygen saturation (S) in pulse oximetry: (P₍dₑₜₑcₜₒᵣ, λ₁) / (P₍dₑₜₑcₜₒᵣ, λ₂) = [P₀ · exp{–[(μₕbO₂,λ₁ – μₕb,λ₁)·S + μₕb,λ₁] · CₕbT · l}] / [P₀ · exp{–[(μₕbO₂,λ₂ – μₕb,λ₂)·S + μₕb,λ₂] · CₕbT · l}] Simplifies to: [(μₕbO₂,λ₁ – μₕb,λ₁)·S + μₕb,λ₁] / [(μₕbO₂,λ₂ – μₕb,λ₂)·S + μₕb,λ₂] where: P₍dₑₜₑcₜₒᵣ, λ₁ and P₍dₑₜₑcₜₒᵣ, λ₂ are the detected powers at wavelengths λ₁ and λ₂, μₕbO₂,λ and μₕb,λ are the molar extinction coefficients of oxy- and deoxyhemoglobin at the respective wavelengths, CₕbT is total hemoglobin concentration, l is the optical path length, S is oxygen saturation. This ratio-based formulation is key to determining SpO₂ using dual-wavelength photoplethysmography.](https://starfishmedical.com/wp-content/uploads/p-detector-4-1024x243.png)
and the unknown physiological parameters CHBT and l cancel out. Generally, λ1 is chosen in the red (e.g. 660 nm), where the difference in oxygenated/deoxygenated optical absorption is large. λ2 is typically chosen in the infrared (e.g. 940 nm), at which wavelength the absorption difference is smaller.
That’s the fundamental concept behind spectrometric oximetry: measure the transmission at 2 wavelenths and invert the ratio to determine the blood saturation!
Complications
As usual with real medical devices, the reality of pulse oximetry is more complicated:
Complication 1: Signal
If you look back at the fundamental relationship between incident and detected power, you’ll see that the detected power – and, hence, the detected signal – shrinks exponentially with distance. The more-absorbing the tissue is, the less-strong the signal, and the more complicated it is to extract a high-quality measurement in the face of real measurement noise and uncertainties. For example, the oximetry analysis will fundamentally be more challenging for people with thicker fingers. Equally concerning is that oximeters for newborn babies who face post-partum complications are usually strapped around the babies’ feet – which are often as large or larger than adult’s fingers!
Another challenge is that – in practice – other biomolecules also affect light transmission. For more darkly-pigmented people, the received signal is, again, reduced in amplitude and more-challenging to analyze [1], [2], [3].This challenge is associated with poorer clinical outcomes for darker-skinned people [4].
The above concerns have motivated the FDA to issue a draft updated guidance on the use and labelling of pulse oximeters [5]. This guidance should motivate oximeter manufacturers to a continued drive to improve performance in challenging signal conditions.
Complication 2: Additional absorbers
As implied above, in practice there are other molecules in the human body that also absorb light: most notably, melanin and lipids. Figure 2 shows the absorption coefficient of these molecules, which can be comparable to that of hemoglobin!
That’s where the “pulse” comes in.
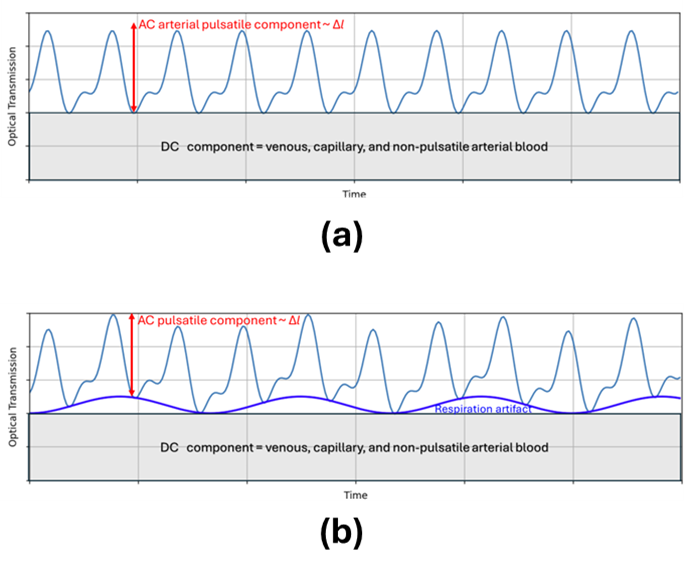
As blood is driven through the arteries by the heart, the arteries’ volume actually changes in time, and so does the total volume of blood in the light-path measured by the pulse oximeter. This leads to a dynamic change in absorption – a change that is not seen in the absorption due to other tissue or – in non-pathological cases – venous blood (see Figure 3a).
This dynamism is key to isolating the absorption signal from arterial hemoglobin. Thus, rather than measuring the average absorption of light, pulse oximeters measure the dynamic signal change due to the volume of additional hemoglobin driven by heart pulsations. Rather than measuring P as above, they measure Pmax/Pmin at each wavelength – and this signal, in principal, isolates the arterial absorption.
Let the maximum additional path length due to arterial expansion be Δl. Then, returning to the equation for optical absorption at a given wavelength, but also including the absorption μother due to additional molecules of concentration Cother, we have:
![An expression modeling the ratio of detected to incident light power, accounting for hemoglobin absorption and additional absorbers: P₍dₑₜₑcₜₒᵣ / P₀ = exp{ –[(μₕbO₂ – μₕb)·S + μₕb]·CₕbT·Δl – [(μₕbO₂ – μₕb)·S + μₕb)·CₕbT + μₒₜₕₑᵣ·Cₒₜₕₑᵣ]·l } where: P₍dₑₜₑcₜₒᵣ is detected power, P₀ is incident power, μₕbO₂ and μₕb are extinction coefficients of oxy- and deoxyhemoglobin, S is oxygen saturation, CₕbT is total hemoglobin concentration, Δl is the pulsatile path length, μₒₜₕₑᵣ and Cₒₜₕₑᵣ account for additional absorbers (e.g., water, melanin, or lipids), l is the total path length through tissue. This equation incorporates both the AC (pulsatile) and DC (non-pulsatile) components, as well as interference from non-hemoglobin chromophores.](https://starfishmedical.com/wp-content/uploads/p-detector-5.png)
If we take the ratio of transmission at maximum arterial expansion (systole) to that at zero arterial expansion (diastole), then – factoring out the term in Δl in the numerator, and remembering that e-0 = 1 in the denominator (in which Δl = 0) we obtain:
![An equation showing the ratio of pulsatile to diastolic light transmission, simplifying the effects of non-pulsatile absorbers: (P₍dₑₜₑcₜₒᵣ / P₀)₍sᵧₛₜₒₗₑ / (P₍dₑₜₑcₜₒᵣ / P₀)₍dᵢₐₛₜₒₗₑ = [exp{–[(μₕbO₂ – μₕb)·S + μₕb] · CₕbT · Δl}] × [exp{–[(μₕbO₂ – μₕb)·S + μₕb] · CₕbT + μₒₜₕₑᵣ · Cₒₜₕₑᵣ · l}] / [exp{–[(μₕbO₂ – μₕb)·S + μₕb] · CₕbT + μₒₜₕₑᵣ · Cₒₜₕₑᵣ · l}] Simplifies to: exp{–[(μₕbO₂ – μₕb)·S + μₕb] · CₕbT · Δl} This final form isolates the exponential term dependent on the pulsatile component (Δl) by canceling out the static absorptive contributions of non-pulsatile tissue and other chromophores, aiding in accurate pulse oximetry measurements.](https://starfishmedical.com/wp-content/uploads/p-detector-6.png)
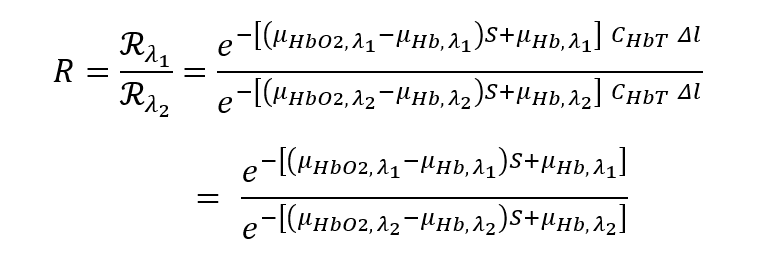
Thus, the ratio R of transmission at systole vs. diastole is given by:
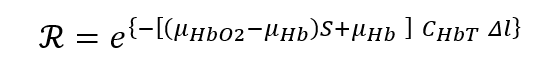
which is similar to our original expression, but now with absorption due to other (non-pulsatile) absorbers cancelled out.
Finally, taking the “ratio of ratios” R at two wavelengths, we recover:
This added measurement step brings with it an additional advantage: the time-varying arterial volume change is correlated with heartbeat. Thus, pulse-flow oximeters enable heart-rate monitoring in addition to oxygen saturation!
Complication 3: Other hemoglobin species
The above approach – truly the heart of “pulse” oximetry – can in principle eliminate confounding signals due to non-hemoglobin absorption from other materials in the optical path length.
However, this approach cannot eliminate contributions to absorption from other molecules in the arterial blood. In particular, hemoglobin can also bind carbon-monoxide; as well, some conditions can lead to hemoglobin’s iron being in the ferrous (Fe3+) rather than the ferric (Fe2+) state – leading to inability to bind oxygen. There can also be contributions to absorption from blood plasma constituents. Traditional pulse oximetry is blind to these components, which can lead to blood-saturation reading errors. One approach to isolating the signal from these “phantom” absorbers is to measure absorption at multiple wavelengths. However, this increases the technical complexity of the hardware and algorithm, and drives up cost.
Complication 4: Scattering
A more fundamental limitation to the “theory of operations” presented above is due to scattering. Hemoglobin can not only absorb the light, but also scatter it in a direction different than the incident one. Like many other biomolecules, hemoglobin is a strong scatterer, and this scattering has a strong forward component. What this implies is that some of the light received by the PFO detector is not absorbed, but rather forward-scattered. Indeed, due to the strong scattering, some of the light received by the detector has been scattered multiple times. Further, the scattering coefficient varies with wavelength in a different manner than does the absorption coefficient.
Thus, the very concept of “optical path length” l is not well-defined. Further, the “effective path length” depends on wavelength, because the scattering coefficient depends on wavelength. And so the cancellation of path length sketched out above is not, in fact, strictly true. In practice, then, rather than inverting the “ratio of ratios” to determine saturation, manufacturers of pulse oximeters assume some linear or low-order polynomial relationship between S and R, such as
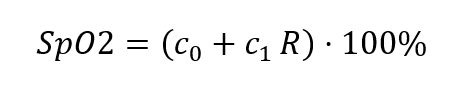
or
![A nonlinear empirical equation for calculating oxygen saturation (SpO₂) from the signal ratio (R): SpO₂ = [(k₁ – k₂·R) / (k₃ – k₄·R)] · 100% where: R is the ratio of detected light intensities at two wavelengths, k₁, k₂, k₃, and k₄ are calibration constants derived from experimental data. This rational function model provides more flexibility than a linear equation and can yield more accurate SpO₂ estimates across a wider range of R values.](https://starfishmedical.com/wp-content/uploads/SP-2.png)
In the above, Sp02 is used instead of Sa02 to indicate that the PFO reading is an estimate of the actual arterial hemoglobin saturation.
Oximeter manufacturers then calibrate their oximeters by correlating their measurements of R on a cadre of healthy volunteers in “breathe-down” tests in which the volunteers’s arterial saturation is varied between approximately 70% and approximately 100% while being monitored by a calibrated co-oximeter (generally, an aterial blood gas oximeter, but potentially an alternate calibrated oximeter).
These clinical tests have the fundamental limitation that the range of saturation values over which the calibation is performed is, by necessity, limited on the lower range. As well, the calibration accuracy may be impacted by the particular demographics of the volunteer cohort. The outcomes of the calibrations are reported on the pooled population, and the requirements on pool demographics may result in under-representation of some subpopulations [6].
For example, the 2013 FDA guidance document “Pulse Oximeters – Premarket Notification Submissions (510(k)s): Guidance for Industry and Food and Drug Administration Staff” recommends a test group of
10 or more healthy subjects that vary in age and sex. Your data should include 200 or more data points (paired observations: pulse oximeter, co-oximeter)… Your study should have subjects with a range of skin pigmentations, including at least 2 darkly pigmented subjects or 15% of your subject pool, whichever is larger.
The draft updated guidance document referred to above5 updates the recommendations on clinical subject makeup, which may result in better overall measurement accuracy across body types of different skin pigmentation levels.
Additional complications:
Additional errors may be introduced into PFO readings due to various artifacts, such as:
- Background light: Transmission measurements may be complicated by background light that leaks into the PFO sensor. Although typical sensors are shielded from such light, movement or poor placement may open up the possibility. Such artifacts are particularly pernicious if they occur on the same timescale as the heartbeat, which serves as the fundamental PFO “data acquisition clock.” However, higher-frequency background-light modulations can also be aliased down in the same timescale.
- Respiration rate: Respiration causes modulation of the heart rate. In particular, the heart rate speeds up but the heart pumps lower volumes of blood when the lungs are full. This results in a reduced AC component in the spectral signal, an increased DC component, and change in the frequency of the fundamental time-scale for data analysis (see Figure 3b). On the one hand, these respiration-rate artifacts can complicate extracting accurate Sp02 values; on the other hand, quantifying the signal changes allows one to monitor respiration rate, as well as heart rate and blood oxygenation.
- Motion artifacts: If the patient under monitor moves, this can affect both background light and respiration rate. Further, body movement can induce variations in local venous blood volume, which can “leak into” the arterial saturation measurement.
Conclusion
Pulse Oximeters are a key part of modern standards of care and provide important input to medical diagnoses in a variety of settings. Regardless of manufacturer, all pulse oximeters share the characteristics and challenges discussed above:
- Oxygenation of hemoglobin in the blood is determined through the variation in optical absorption/scattering between oxygenated and deoxygenated hemoglobin.
- Measuring this variation is more challenging when the optical absorption is higher.
- Measuring optical transmission at two or more wavelengths allows the contribution of configuration-specific artifacts to be isolated.
- Measuring the optical impact of the pulsatile arterial flow allows one to isolate the contribution of background absorption by other biomolecules. It also enables simultaneous heart rate monitoring.
- However, 2-wavelength PFO can be confounded by absorption due to other hemoglobin species such as carbaminohemoglobin or methemoglobin. Measurement at additional wavelengths of light can help isolate these signals in principle.
- Due to scattering, the effective optical path length for light passing through tissue is wavelength dependent. Thus, manufacturers rely on calibration of their measured “R values” to co-oximeter readings in clinical trials.
- PFOs can be vulnerable to spurious signals due to background light, motion, or respiration. However, in the latter case, correction for respiration-rate artifacts enables simultaneous reporting of respiration rate.
Oximetry algorithms for medical-grade pulse oximeters are typically core IP for medical-device manufacturers. However, I hope this blog has given you some flavor for the challenges these device manufacturers face and surmount. For the curious, there are some more-detailed descriptions available of commercial-grade oximetry algorithms and how they address the challenges (e.g. Renesas Application Note: “OB1203: Pulse Oximeter Algorithm for SpO2, Heart Rate, and Respiration Rate,” (2022).)
The next time you see “that finger clip device,” you’ll have a better idea of how it works – and the important role it plays in monitoring patient health! The optics team at StarFish Medical are always interested in hearing about new applications and devices the use optical technologies. Please contact us to discuss your project.
Brian King is Principal Optical Systems Engineer at StarFish Medical. Previously Manager of Optical Engineering and Systems Engineering at Cymer Semiconductor/ASML, Brian was an Assistant Professor at McMaster University. Brian holds a B.Sc in Mathematical Physics from SFU, and an M.S. and Ph.D. in Physics from the University of Colorado at Boulder. His research centered on implementing quantum information processing with trapped, laser cooled atoms – often single atoms confined in radiofrequency ion traps operating at ultrahigh vacuum.
References
[1] Bickler, et al., Anesthesiology, 102, 4, 715 (2005); doi:10.1097/00000542-200504000-00004.
[2] Feiner, et al., Anesthesia & Analgesia,** 10**5, On Line Suppl., (2007); doi:10.1213/01.ane.0000285988.35174.d9
[3] Sjoding, et al., N Engl J Med 383, 2477 (2020); doi: 10.1056/NEJMc2029240
[4] Moran-Thomas, Boston Review (August 5, 2020)
[5] “Pulse Oximeters for Medical Purposes – Non-Clinical and Clinical Performance Testing, Labeling, and Premarket Submission Recommendations,” Docket Number FDA-2023-N-4976.
[6] Jamali, et al., “Racial Disparity in Oxygen Saturation Measurements by Pulse Oximetry: Evidence and Implications,” Annals of the American Thoracic Society, 19, 12 (2022); https://doi.org/10.1513/AnnalsATS.202203-270CME March 24, 2022.