Laser Speckle Contrast Imaging: Visualize Invisible Fluid Flows
How to build a breadboard proof-of-concept system
It’s advantageous, when possible, for medical techniques to be non-invasive and inexpensive. One method of imaging flow (of blood and other optically scattering media) that meets these criteria is Laser Speckle Contrast Imaging (LSCI).
Visualizing fluid flows has many applications in various fields of science and engineering. The imaging of blood flow (perfusion) has clinical relevance in multiple fields1 where it is useful to be able to visualize flows that would usually be invisible to the human eye. This imaging is used in dermatology to assess the severity of burns, in ophthalmology to assess various diseases of the eye, and in neurology to monitor cerebral blood flow during brain surgery. Many additional examples are either in current clinical use, or under active research for future application.
Laser Speckle Contrast Imaging Overview
LSCI is a simple technique that requires only a camera with an appropriate lens, a low-power monochromatic (i.e. single-colour) laser, and a lens to expand the laser beam. An effective LSCI setup can be made from inexpensive parts (a disassembled webcam, a laser pointer, and three inexpensive lenses) for less than $100, with performance similar to that achieved using ~$3500 worth of scientific-grade parts.2 No physical contact (except by light) is required for the technique to be effective and the lasers used can be of sufficiently low power that strong safety controls are not required.
LSCI relies on a phenomenon known as the “speckle pattern,” observed when a laser beam shines off rough surfaces. When the incoming laser beam is expanded by a lens, the illuminated area takes on a “grainy” appearance.3 This results from the interaction of light waves scattering off different parts of the surface, which “add” to each other (i.e. constructively interfere) to create bright spots or “subtract” (i.e. destructively interfere) to create dark spots. The regular periodic “shape” of the laser light waves, which for a monochromatic laser is very close to a simple sine wave, creates a well-defined speckle pattern. For light waves that do not have a regular periodic shape, such as white light from an incandescent light bulb, such patterns are generally not observed, as the underlying light waves vary too rapidly in time.
When a speckle pattern is created by a static object, the pattern is itself static. If the object is moving or flowing, a dynamic speckle pattern results due to the changing optical scattering characteristics as the surface on which the light is incident changes in time.
In LSCI, a camera having a set exposure time captures the laser-illuminated image. Static structures show the same speckle pattern over time on the camera sensor, so the speckle remains well resolved in the captured image. On the other hand, if an object in the frame is flowing, the speckle arising from that part of the image will “wash out” over the exposure time of the camera as the object changes, leading to a part of the image where little speckle is observed. By calculating the local contrast of the image, you can identify static and moving areas by finding where there is low and high contrast in the speckle pattern, respectively. The relationship between flow rate and contrast is complex, and depends on the experimental conditions. For this reason, LSCI is often used qualitatively, rather than quantitatively.1,4
Mathematically, the local contrast is calculated for each pixel in the image according to the expression

in which is the mean of the light intensities recorded on the pixels in a region surrounding the pixel of interest, and σ is the standard deviation of the same intensities. Areas of 5 x 5, and 7 x 7 pixels surrounding the pixel of interest have been found to give a good balance between spatial resolution and statistical robustness.4
By replacing each pixel in the original image with the normalized contrast value calculated in the region surrounding that pixel, a contrast image is created, showing the variations in contrast caused by flow. Using software techniques common in image processing and machine vision, the required calculations can be done in near real-time, with multiple images processed each second and displayed as video.
Breadboard proof-of-concept
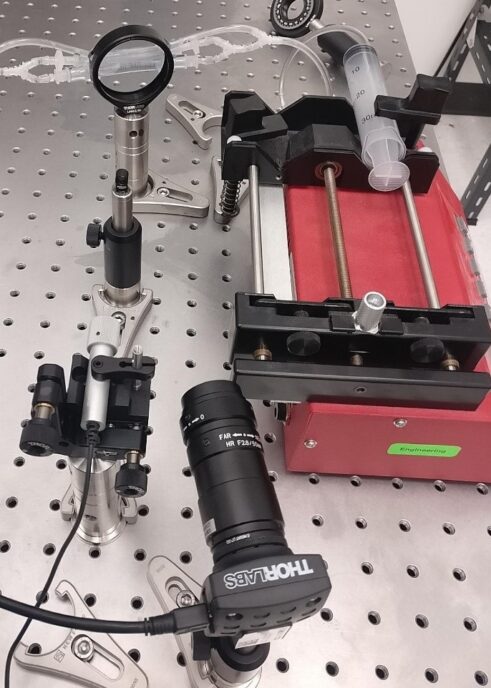
I recently built breadboard proof-of-concept embodiment of a fluid-flow measuring system using LSCI. A picture of this setup is shown in Figure 1. The setup is simple, consisting of only a 5 mW continuous-wave diode laser, a short-focus lens for expanding the laser beam, a monochromatic camera, and an imaging lens for the camera. Only the imaging lens has some special requirements, needing a certain f-number for the best results in imaging the speckle, while simultaneously having an appropriate field of view.6,7 However, even many common camera lenses have some ability to image the speckles and therefore some ability to distinguish between moving and static objects using LSCI.

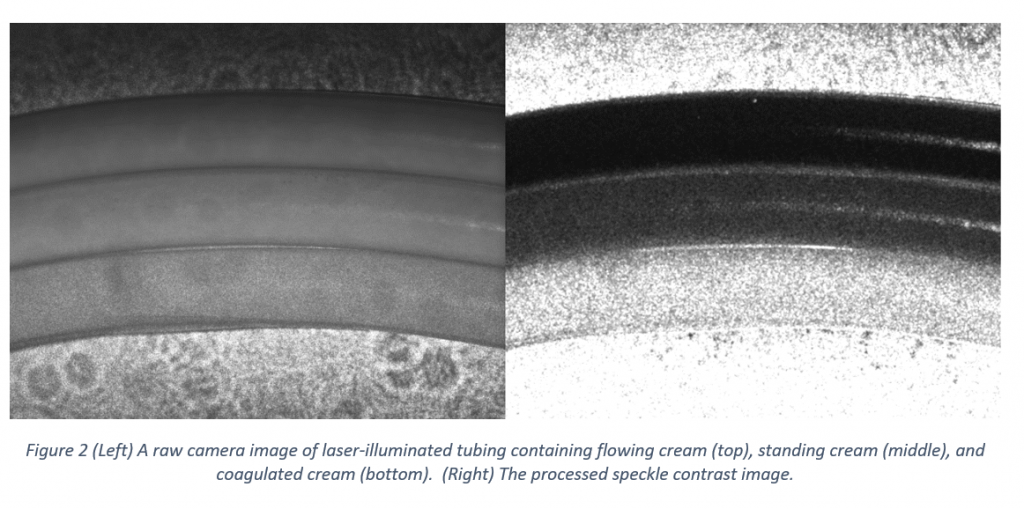
To test the setup, I used cream as a sample for its availability, lack of biosafety concerns, and optical scattering properties (other biological fluids such as blood have similar scattering properties). An example of the results, showing the raw laser-illuminated image and the processed speckle contrast image is shown in Figure 2.8

From top to bottom, the three tubes shown contain flowing cream, standing (but liquid) cream, and coagulated (near-solid) cream. In the processed image, darker areas correspond to lower local contrast (and therefore greater flow) compared to the lighter areas.9 As expected, the flowing cream shows the lowest contrast and the coagulated cream shows the highest. The standing cream shows intermediate contrast, indicating that there is still some motion even when the cream is standing (likely due to particle diffusion).
Note that the differences in speckle contrast are visible even before processing the image. In particular, the speckle pattern is readily apparent on the coagulated cream, with the pattern on the flowing and standing cream appearing to be “washed-out” to different degrees. Calculating the speckle contrast image is nonetheless worthwhile, as it allows for contrast differences in small local areas to be highlighted, removes the need for subjective assessment of the level of contrast, and, in a more complex analysis, allows for semi-quantitative evaluation of the relative flow rates.
Our particular proof-of-concept setup uses scientific-grade parts and has a cost of approximately $850 (not including the sample components, as they are not part of the measurement apparatus). Most of the cost is in the camera, its lens, and the laser. There is potential to greatly reduce the expense. The bare components required, such as image sensors and laser diodes, can cost as little as a few dollars each. Additional electronics would be required, and the technical challenge would be greater. Appropriate lenses can be purchased off-the-shelf for ~$70 or less and mounts can be 3D printed for prototyping or molded. Scaling up manufacturing can reduce the cost further as parts are purchased or manufactured in bulk.
Conclusion
Laser speckle contrast is a useful tool with applications in clinical practice and additional medical applications currently being researched. It is a technique that is versatile, simple, non-invasive, and inexpensive. Visualizing the invisible doesn’t always have to be difficult! Talk to us about your optics or other medical device development needs in a free, 30 minute no obligation consultation.
- Heeman et al., “Clinical applications of laser speckle contrast imaging: a review”, J. Biomed. Opt., 24(8), 080901 (2019)
- M. Richards et al., “Low-cost laser speckle contrast imaging of blood flow using a webcam”, J. Biomed. Opt. Express, 4(10), 2269 (2013)
- The speckle pattern may be suppressed in certain lasers, such as those with a large optical bandwidth.
- Abdurashitov et al., “Off-axis holographic laser speckle contrast imaging of blood vessels in tissues”, J. Biomed. Opt., 22(9), 091514 (2017)
- Briers et al., “Laser speckle contrast imaging: theoretical and practical limitations”, J. Biomed. Opt., 18(6), 066018 (2013)
- A. Boas, A. K. Dunn, “Laser speckle contrast imaging in biomedical optics”, J. Biomed. Opt., 15(1), 011109 (2010)
- In the absence of significant optical aberrations, the diameter of a speckle imaged on the camera is given by the expression ρspeckle = 2.44λ(1 + M) ƒN where λ is the laser wavelength, M is the magnification of the imaging lens, and ƒN is the lens’ f-number (the ratio of its focal length and its entrance pupil diameter). For best results, diameter of the imaged speckle should be at least twice the width of a camera pixel.
- These images were taken using an earlier but near-equivalent setup to that shown in figure 1. The only significant differences were that all of the tubes used in imaged setup were the same diameter, and were mounted against a wall rather than inside a lens mount.
- To emphasize differences in the low contrast areas, the maximum calculated contrast value displayed was restricted to K = 0.2. White areas of the image have calculated local contrasts that are equal to or greater than the maximum.
Ryan Field is an Optical Engineer at StarFish Medical. Ryan holds a PhD in Physics from the University of Toronto. As a post doctoral fellow, he worked on the development of high-power picosecond infrared laser systems for surgical applications.
Images: StarFish Medical
In many cases, optical scattering plays a strong role in the propagation of optical radiation. One common approach to simulating scattering is the Monte Carlo technique.