8 Tips to implement POC diagnostic platform optical detection
This blog offers eight tips to help successfully implement a POC diagnostic platform optical detection with a disposable microfluidic cartridge. With the changing healthcare ecosystem, demand for point-of-care (POC) testing kits is expanding globally. Medical technology companies are accelerating development or repurposing platforms to address the need for portable diagnostic tools at the point of care using disposable microfluidic chips to screen for a variety of diseases. For COVID-19 alone, the Canadian federal government has announced plans to produce 40,000 test kits a month for the next 12 months.
These test kits, in the form of a microfluidic cartridge or chip, could be used in hospitals, clinics, remote locations, and even at home. Any home-use testing kit would need to be performed by a consumer, not a trained medical practitioner.
A point-of-care diagnostic tool or testing kit typically includes reagents, a sample collection device that depends on the type of disease for which it is intended, a microfluidic cartridge into which the sample is introduced and in which the necessary chemistry takes place, and a reader to collect the data and present the results.
The main advantage of POC devices is that the results are immediately available. It is not necessary to wait for hours or days: hence doctors can make timely and quick decisions for their patients’ medical care. In terms of usability, such devices are designed to get data in real time and be easy-to-use. They are a convenient and accurate tool for diagnostic, monitoring and screening tests.
One of the critical technologies behind the success of most POC devices is the optical detection mechanism. There are other detection techniques, but optical detection is the most widely used.
Here are eight tips to help successfully implement a POC diagnostic platform optical detection:
1. Start with the right requirements. Know your cartridge requirements: its target product profile (TPP). The TPP will become the basis of design and component-selection decisions. Within the TPP, define the workflow, the volume of reagents needed, and the properties of the reagents needed for a particular product. The source of the required sample should also be identified: whether it comes from blood, urine, saliva, nasopharyngeal swab, stool, tears or sweat. The type of sample determines the complexity of the cartridge, how the sample will be prepared to extract a particular target analyte, and the steps required for the subsequent reactions.
The TPP also defines the target Limit of Detection (LOD) and the Limit of Quantification (LOQ). LOD is the capability of the system to detect a particular analyte of interest while the LOQ is the capability of the system to quantify the analyte with precision and accuracy. LOD and LOQ will become the basis of optical-detection system design. Understanding the TPP requirements and thinking of an integrated system solution is the right approach.
2. Select an appropriate assay. In a nutshell, the assay is the “chemistry” that you use to test for the presence or concentration of the analyte you are targeting (i.e. the infectious agents or antibodies). The most-common assays are cell-based, molecular and immune assays. If you already have an assay in mind, or have developed an appropriate assay in the past, that’s good news! However, if you are still deciding what assay to use, then the following points will be useful to bear in mind.
If you are concerned with the detection modality, there are various detection technologies that can be selected, such as electrochemistry, visual indicators as in the Lateral Flow Assay strip, luminescence, fluorescence or direct electrical signals generated during the reactions. Optical detection is by far the most popular choice in these assays. For cell-based assays, cells are tagged with a fluorescent dye that can be viewed under a microscope. In an immunoassay, the antibody is tagged with a fluorescent molecule, while for molecular assays, the DNA or RNA are labelled with a fluorescent probe.
If the TPP requires a cell-based assay, you need to identify the cells that must be tagged with fluorescent dye for detection in your optical system. The optical system must be designed in a way that it is specific to the light emitted by the tagged cell and insensitive to light scattered or emitted by the other cells or products in the solution.
If cell counting and separation are involved, the optical detection system should be fast enough to capture information at a frame rate appropriate for the flow speed.
In immunoassays and molecular assays, a light-intensity measurement or image capture at a pre-determined rate is sufficient for simple and real-time operation, depending on the sensitivity of the detector. If the signal is too low to be detected, it is worthwhile to consider amplification techniques. Photomultipliers or newer-technology silicon photomultipliers which amplify the signal from the collected photons are recommended for capturing low levels of light. For immunoassays, a brighter fluorescence tag can be used. For molecular assays, you may need to amplify the target analytes (using PCR or LAMP, for example) in order for your optical system to capture the signal.
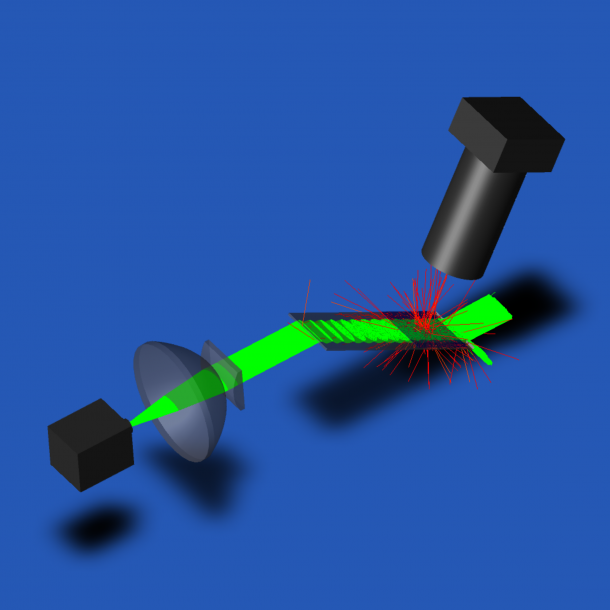
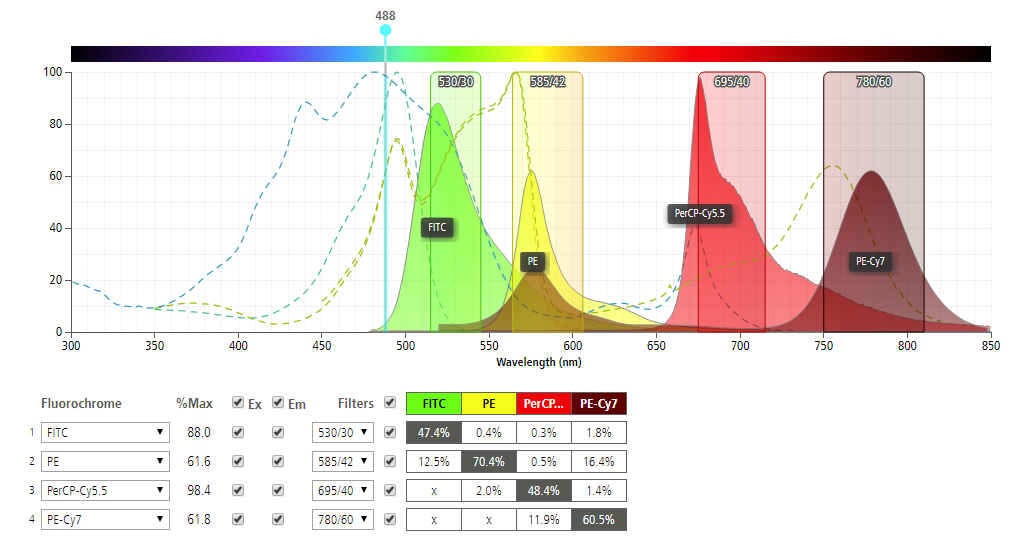
3. Simulating the light excitation and emission. Implementation of the optical detection system depends mainly on the light signals to be captured. As standard practice, the target analytes are illuminated with light in a specific range of wavelengths (excitation) and the optical detector receives emitted light from a different specific range of wavelengths (emission). Hence, it is important to select an appropriate fluorophore for your assay given the excitation and emission wavelength. This can go the other way as well. Your fluorophore can be used to define your excitation and emission wavelengths. Published research papers are available to guide you on the selection process. Furthermore, companies like Becton Dickinson (BD) provide a variety of fluorochromes for flow cytometry using different laser wavelengths throughout the UV and visible range for excitation.
At a given excitation wavelength, the emission wavelengths vary with each fluorochrome. This emission can be efficiently detected by using an optical filter in front of the detector to block excitation light while transmitting the emitted light. BD’s spectrum viewer simulates the emission response as a function of the excitation wavelength which is very helpful. In the chart, four (4) example fluorochromes (FITC, PE, PerCP-Cy5.5, PE-Cy7) and the recommended filters are shown with corresponding waveforms. The excitation wavelength of 488 nm for example, provides different responses for each fluorochrome.

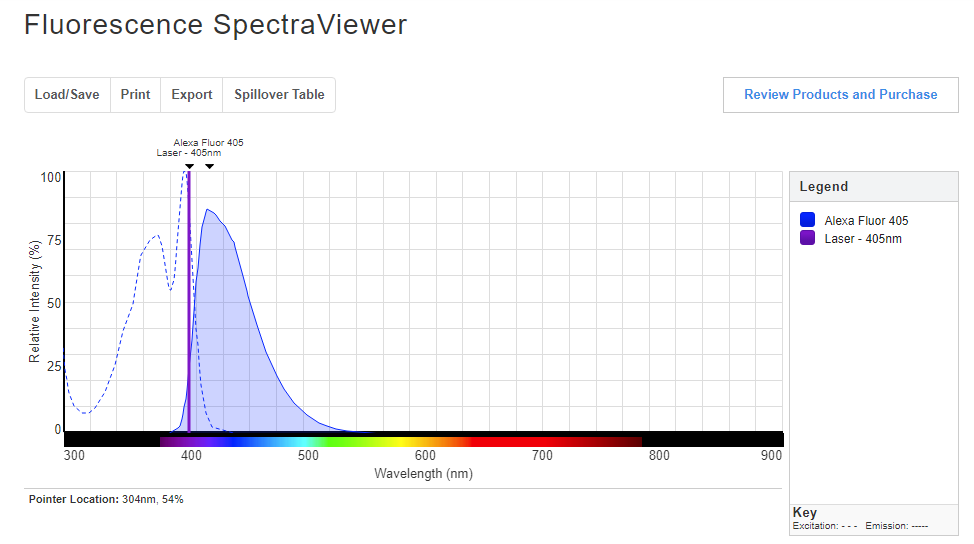
Thermofisher Scientific also has a similar tool: the Fluorescence SpectraViewer. To use this simulator, one needs to select the fluorophores, light sources, excitation filter, and emission filter. For example, select a laser excitation wavelength of 405 nm using Alexa Fluor 405. The peak emission wavelength will be at 415 nm with relative intensity of around 86%. Try a few different combinations!

4. Study the critical optical design considerations. After experimenting with your assay on the bench and gaining a high level of confidence that it works, it’s time to explore translating your assay to a microfluidic cartridge format with optical detection in mind. Your microfluidic cartridge will be designed to perform sample preparations, assay workflows and processes. Depending on the complexity of the optical platform, it is worthwhile to consider if you can integrate some of the optical features on the cartridge.
The decision to integrate optical components on the cartridge will depend on the intended functionality, complexity of the reader, signal detection capability and technical complexity of the cartridge design. In general, most of the complex optical systems should be in the reader, whereas the microfluidic cartridge should be kept as simple as possible. However, even if the overall detection system requires a complex optical subsystem, some low-risk features can be incorporated on the cartridge. Typically, such optical features include lenses, light guides, or optically transparent plates. The integration decision is a balance between the overall consumable cost and manufacturability of such features against the workflow requirements of the assay. In general, it is advisable to make the microfluidic cartridge as simple as possible and to transfer the optical complexity to the reader.
5. Select the appropriate light source and system configurations.Lasers are the preferred excitation light sources due to their specific, narrow emission wavelengths and high brightness. Lasers are used for excitation in flow cytometry, diagnostic tools, imaging and other research laboratory equipment. On the other hand, high-power LED options can also be considered. An LED emits an incoherent beam of light and its power in a given direction and optical bandwidth is relatively low. High power LEDs are now available for the excitation wavelength of choice for every conceivable fluorophore. A number of LEDs with wavelengths ranging from ultraviolet (365 nanometers) to infrared (greater than 800 nanometers) are commercially available.
In florescence microscopy, lamps are the most common illumination source. Common types of lamps include tungsten-halogen, mercury arc, xenon arc and metal halide. These lamps are highly reliable as light sources for fluorescence imaging. For point-of-care applications, these lamps necessitate the use of different light filters and focusing mechanisms which increase the overall footprint as well as the power requirements of the device. To decide which type of light source to use, you need to consider the intrinsic brightness of the light source, the focal length of the collection lenses, the numerical aperture, filters, the diaphragm aperture, and, of course, the capture camera.
6. Source appropriate lenses, baffles, mirrors and fiber optics. Lenses are an integral part of the optical detection in a point-of-care diagnostic platform. Since you are working with micron-sized features as well as in low light conditions, you need to be careful not to overlook key considerations. One is proper specification of microscope lenses or any customized lenses. Other components may include filters, mirrors, baffles to prevent stray light, light guides and/or fiber optics. Determining the proper focal distance is also crucial. For a space-limited setup, mirrors and adjustable lenses must be incorporated. One of the critical considerations is the ability of the system to enable both coarse and fine tuning. Auto-focus should be employed to ensure the image is focused and light is properly captured when using a camera. Fiber optics or light guides are often use to transfer light to specific areas within the microfluidic cartridge to provide a well-focused excitation light. Simulation tools are available to help design custom light guides or to assess the operation of optical fibers.
7. Scan the generated data and perform image analysis to validate the results. Finally, you can now scan your data and perform image analysis. Using a photomultiplier tube (PMT), the reading can be obtained using either the voltage or current. The reading could be obtained per unit of time. The amount of signal collected can be correlated to the level of reactions in the reagents of your sample. The result can be plotted in a chart from which recommendations can be drawn. On the other hand, using a camera, a single frame of data can be obtained at a pre-identified rate.
Multiple frames can be captured to form a series of images comprising a video. Various programs can be used for image analysis. You could use open source image analysis software such as image J. However, analyzing images involves a huge set of data and may require significant hard drive space. It is also time consuming to analyze captured images. It is therefore recommended to develop customized software or use off the shelf image analysis tools to automate this process. New image analysis tools are available for education and research purposes.
8. Signal capture on microfluidic cartridges. In designing microfluidic cartridges, a detection window must be incorporated. This window is the interface between the cartridge wherein the assay is processed and the optical detection device that measures the resulting reactions. It is also called the detection reservoir, port, well or region. It could be a single area or multiple areas wherein the final reactions have occurred and the detection is carried out.
The above-mentioned tips are not exhaustive for how to best implement an optical detection system on microfluidic diagnostic chips. However, they will serve as a guide to avoid pitfalls in designing and implementing your optical detection system. I would enjoy hearing additional tips and recommendations from readers. I encourage anyone working on a POC diagnostic platform optical detection to contact me and my colleagues for a no obligation 30-minute consultation.
Lorenzo Gutierrez is the former StarFish Medical Microfluidics Manager and Interim Toronto Site Director. Lorenzo has extensive experience translating point of care assays to microfluidic cartridges. His microfluidics portfolio includes developing a polyvalence instrument for early infant diagnostics at Chipcare.
Images: StarFish Medical