Using the Jupyter Notebook for product prototyping
In this post, I’d like to share with you a toolkit that I’ve found works quite well with both my creative process and my workflow: the Jupyter notebook, and the Python/Numpy/Scipy stack.
The initial design stages for a new optoelectronic device are chaotic, and require a broad variety of technical skills and approaches: literature searches, brainstorming, “back-of-the envelope” calculations, numerical simulation, and so on. At the breadboarding stage, one generally has to keep track of data from a variety of sources, and try a number of approaches to making sense of that data.
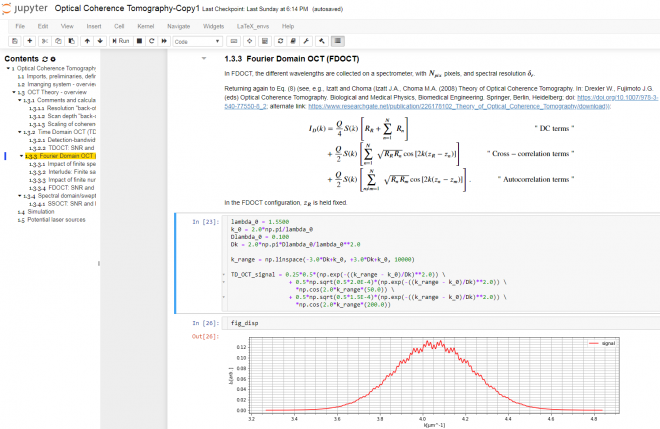
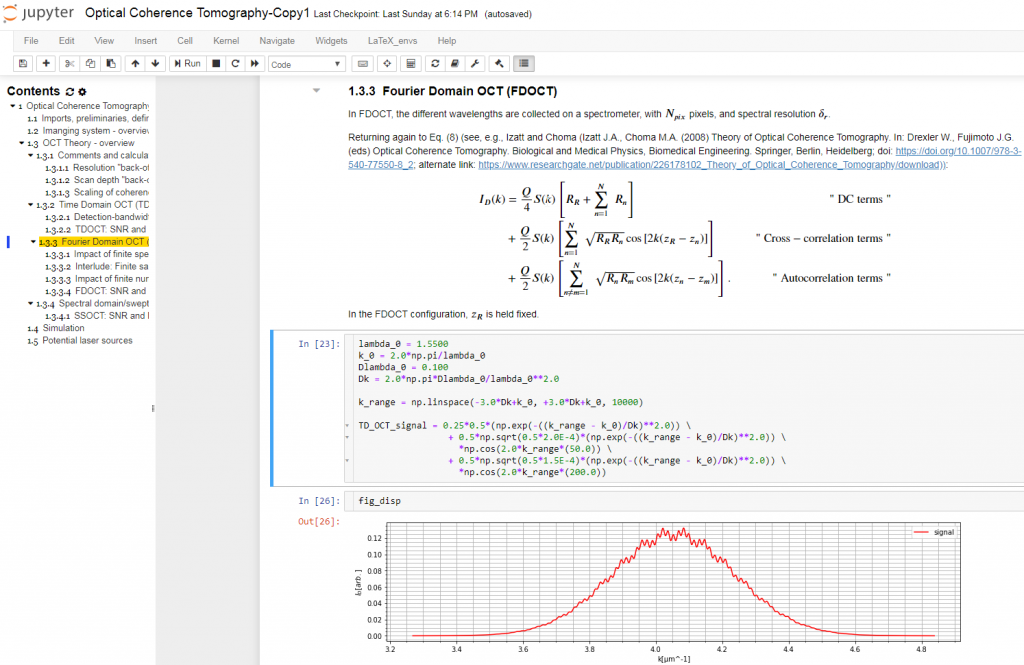
The Jupyter Notebook is an interactive platform for data analysis and exploration. Over the past few years, it has seen growing adoption by the scientific research, genomics, and data science communities. It is an excellent tool for collecting and organizing thoughts, information sources, and simulations as I start to conceptualize the solution to an optical measurement challenge. The Notebook is a Markdown-savvy, web-based interface to a back-end computation kernel, accessed through a web page. That’s quite a mouthful, but Figure 1 illustrates what it means.

With the notebook, I can intersperse executable code segments with Markdown text to describe my thought process. The Markdown text cells provide a nicely formatted text display, according to Markdown syntax. This syntax supports hyperlinks, simple image display, bulleted lists, and tables. The cells are LaTeX-savvy (so you can typeset mathematics in a manner that displays the results in an attractive format) and html-savvy (so you can fall back to html for more-nuanced display of content).
As Figure 1 shows, I typically capture my initial thoughts in Markdown cells – then flesh out those thoughts with code. Explaining the thought process textually not only allows me to reconstruct my thoughts later, but also helps me refine my thinking. The ability to produce well-controlled typeset mathematical equations enables me to precisely and succinctly record my quantitative thinking. Any background references are easily hyperlinked for later retrieval.
The Jupyter Notebook currently supports computational kernels in well-over 50 different programming and computational languages including Python, R, Julia, interactive C++, JavaScript, Scala, Lua, and Ocaml.
I choose to use Python for my workflows. It’s easy to program and easy to read, and has an extensive “ecosystem” of scientific packages. In the fluid world of ideation, its dynamic typing allows me to focus more on the logic and less on variable declarations. (Of course, the flip side of this is the danger of the occasional subtle bug if I later make unwarranted assumptions about variable types: caveat emptor…)
Python also has a well-developed ecosystem for scientific computing. Key components that I often call upon include the following:
- NumPy
The NumPy package implements efficient array and matrix computations. (The core elements of numpy are implemented in C, so computational efficiency is reasonable…) - SciPy
SciPy builds upon NumPy, and implements more physically applied computations. I often call upon:- interpolate to extract values from discrete data from sources such as scientific papers or manufacturers’ data sheets.
- optimize.curve_fit for fitting data to models. Although this module’s current interface is somewhat clunky, it gets the job done.
- constants for CODATA-recommended values of my favorite physical constants.
- random for random-number generation according to a wide variety of probability distributions
- pandas
pandas is meant to manipulate dataframes, which are a kind of generalized spreadsheet. They are a handy container for multi-type data sets. pandas allows easy import of such data sets, as well as filtering, pivot-table creation, and calculation of aggregate statistics. pandas is also generally convenient for importing csv- or Excel-type data and converting to e.g. NumPy arrays. - SymPy
The SymPy package handles analytic calculations. While analytic expressions may seem quaint or obsolete in light of the available numerical techniques, they are unparalleled for developing physical intuition. As a simple example, an analytic approximation allows one to “sanity check” by taking limits. SymPy is a substantial computer algebra system built upon python, and includes special functions, algebraic manipulation, analytic differentiation, and analytic and numeric integration.
For plotting data, I typically use the venerable matplotlib, which has a MATLAB-like set of plotting commands. matplotlib offers both an imperative and an object-oriented API. The former is convenient for “quick and dirty” plotting. More-complex figures, or figures whose layout requires more control, are usually better-implemented with the object-oriented API. Nicolas Rougier has created good set of introductory tutorials.
The Jupyter Notebook offers a number of rendering options for matplotlib. The newer “notebook” mode is interactive – with built-in tools for panning, zooming, etc. However, if I’m not diligent about closing (de-activating) the plots, my notebook performance gets bogged down. For that reason, I tend to use the older, non-interactive “inline” mode. It tends to get the job done.
Finding and installing all the above packages could be quite daunting. Fortunately, there are a number of options for free, prepackaged, easy-to-install “python ecosystem” packages, such as Enthought Deployment Manager, Python(x,y), or the Anaconda Distribution. I typically install the latter: on Windows at work, and on Kubuntu Linux on my personal computer. Installation is typically as simple as double-clicking on the installer (though environment customization can require a little more tweaking).
A word of caution is appropriate for those of us employed in the commercial sector. Pay attention to the license limitations of the software you use, so that you don’t expose your employer to liability! Even more importantly, consider the security of your company’s and/or your clients’ intellectual property, particularly if you’re considering remotely hosted resources (such as some python plotting modules).
While I wouldn’t recommend it for “production” code, I find the Jupyter Notebook and numpy/scipy-enabled python a very good mix for the early stages of device-design and proof-of-concept work.
Further reading:
- Another overview of the Jupyter notebook.
- A gallery of Jupyter Notebooks using various computational kernels.
- The Python Data Science Handbook.
- NumPy for Matlab users.
- Scipy Lecture Notes.
- Jake VanderPlas provides some good advice on cleaning up your Notebooks while the “mists” are clearing, and after.
- Improving execution times using native Python and Numba.
Full disclosure – the Jupyter Notebook was initiated by two people from my PhD Physics at the University of Colorado, Boulder: Fernando Perez and Brian Granger. I discovered this after I had already adopted the Jupyter Notebook. I suggest you make up your own mind as to whether the Notebook fits into your own workflow.
Brian King isPrincipal Optical Systems Engineer at StarFish Medical. Previously Manager of Optical Engineering and Systems Engineering at Cymer Semiconductor, Brian was an Assistant Professor at McMaster University. Brian holds a B.Sc in Mathematical Physics from SFU, and an M.S. and Ph.D. in Physics from the University of Colorado at Boulder.
Photo Credit: Jupyter logo: https://jupytercon.com/about/