Bio Break: Understanding Limit of Detection and Limit of Quantification in Assay Development
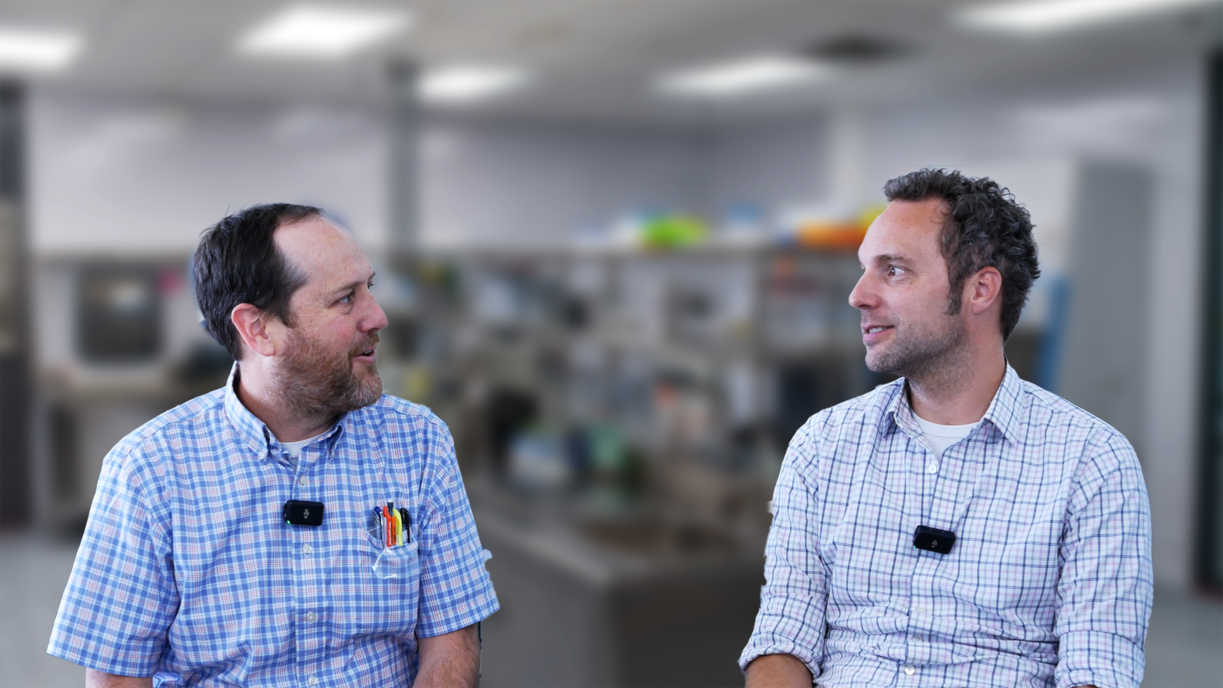
Dive into the world of assay development with this informative episode of Bio Break, where Nick and Joris explore two critical concepts: Limit of Detection (LOD) and Limit of Quantification (LOQ). These terms might sound similar, but their implications for clinical diagnostics and medical devices are vastly different. Whether you’re an engineer, researcher, or product developer, this video sheds light on why both LOD and LOQ are vital in ensuring the precision and reliability of diagnostic tests.
Nick breaks down these acronyms, explaining how LOD refers to analytical sensitivity — essentially, how low your system can detect an analyte. Meanwhile, LOQ focuses on functional sensitivity, or how well the assay performs in real-world applications, considering variables like user handling, reagents, and diverse physiological conditions. With real-world examples, this discussion highlights the importance of understanding these thresholds to create accurate and effective diagnostic tools.
In this episode, learn about the rule of thumb engineers use to determine these limits: aiming for three standard deviations above the detection limit for LOD and a robust ten standard deviations for LOQ to ensure consistent results in practical settings. From engineering perspectives to real-world applications, Nick and Joris share insights that bridge the gap between theory and practice in assay development.
If you’re navigating the complexities of medical device or diagnostic development, this episode is a must-watch! With a focus on how engineering and functionality intersect in LOD and LOQ testing, you’ll gain actionable insights for your projects.
Key topics covered:
- What LOD and LOQ mean for assay development.
- Differences between analytical and functional sensitivity.
- The importance of statistical thresholds in diagnostic reliability.
Don’t miss out—watch now to elevate your understanding of assay performance metrics!
Understanding LOD and LOQ in Assay Development
Related Resources
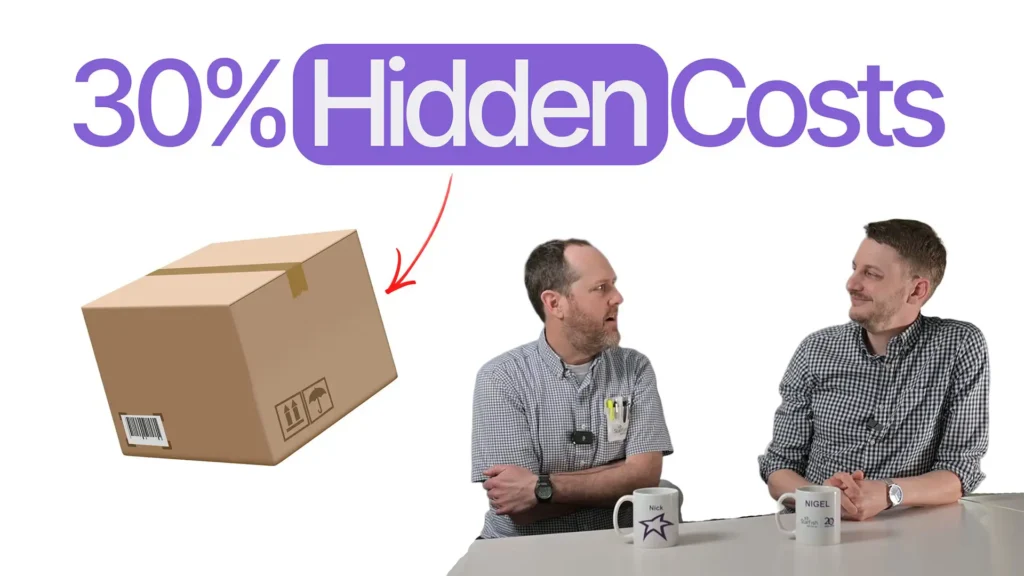
Nick and Nigel breaks down what actually goes into the cost of getting a sterilized device into a user’s hands, and why up to 30% of costs can sit in places most teams don’t plan for.
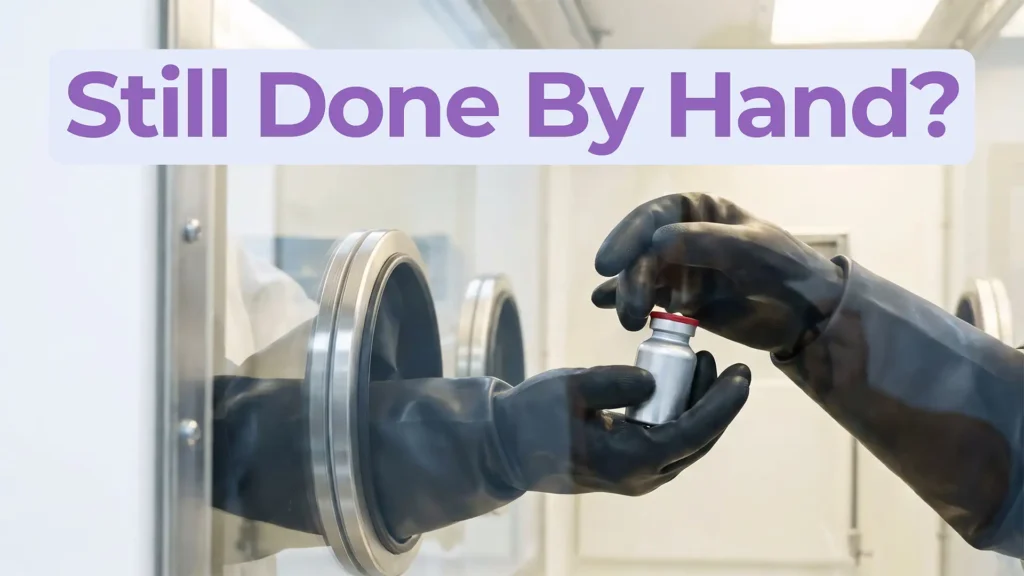
Theranostics combines diagnosis and therapy into a single targeting system, using one ligand to attach to two different radioactive payloads, one for imaging and one for treatment. It represents a significant shift in how cancer is being identified and treated. But the theranostics delivery workflow tells a different story.

Most medical devices were designed for clinical settings, not the patients and caregivers who increasingly rely on them at home. Here’s what good home-use device design actually requires.

How do you measure comfort in medical device design? Explore the tools, scales, and study design principles that turn a subjective experience into actionable design data.